Predictive AI in Aviation: Enhancing Engine Performance and Reliability
1. Introduction: Why Engine Reliability Matters in Modern Aviation
In an industry where every second of uptime matters, and safety is non-negotiable, Air Operator Certificate (AOC) holders must prioritize performance, compliance, and proactive maintenance. At the heart of this mission lies engine performance reliability—a vital area that determines fleet availability, turnaround times, and passenger trust. With advances in Artificial Intelligence (AI), what was once retrospective and reactive can now become predictive and strategic. This whitepaper explores the power of AI in transforming engine performance insights and how operators can harness it to improve reliability, reduce costs, and elevate safety.
2. Key Metrics in Engine Performance Reliability Reports
An Engine Performance Reliability Report is a cornerstone for operational insights. Each field provides a crucial piece of the puzzle, indicating engine health, utilization, and maintenance demands.
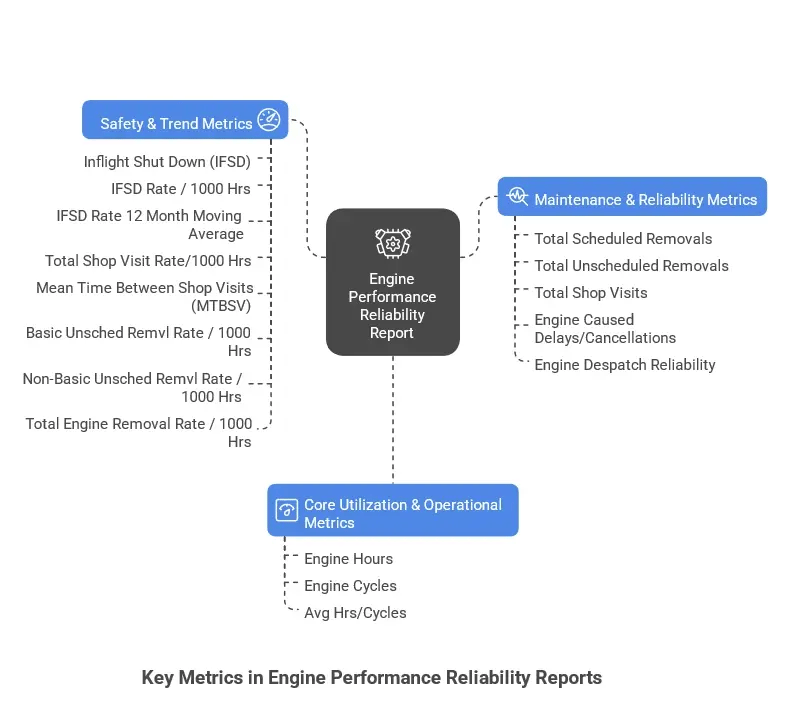
2.1 Core Utilization & Operational Metrics:
- ENGINE HOURS:
The total operating hours accumulated by a particular engine type during the specified period. This is a primary measure of engine utilization. (Total Flying Hours per Aircraft × Number of Engines Fitted per Aircraft).
- ENGINE CYCLES:
The total number of engine cycles accumulated during the period. An "engine cycle" typically refers to one take-off and one landing sequence, involving a full thrust cycle (from idle to take-off power and back to idle). Cycles are a critical fatigue driver for engine components. (Total Flying Cycles per Aircraft × Number of Engines Fitted per Aircraft).
- AVG HRS/CYCLES:
The average flight hours per engine cycle. This metric provides insight into the typical flight duration. Longer flight hours per cycle generally indicate less frequent stress cycles on components.
2.2 Maintenance & Reliability Metrics:
- TOTAL SCHEDULED REMOVALS:
The number of engines removed from the aircraft for planned, preventive maintenance, or overhaul as per the maintenance program.
(I) PLANNED: Removals due to reaching a pre-defined time or cycle limit (e.g., TBO - Time Between Overhaul).
(II) PREVENTIVE: Removals for proactive inspections or tasks designed to prevent future failures.
(III) CONVENIENCE: Removals scheduled opportunistically (e.g., during a larger aircraft check) even if the engine hasn't reached its full time limit, or for minor issues conveniently addressed during a planned removal.
- TOTAL UNSCHEDULED REMOVALS:
The number of engines removed from the aircraft due to unpredicted issues, failures, or defects that require immediate attention and were not part of the pre-planned maintenance schedule. These are typically more costly and disruptive.
(I) SIMPLE: Unscheduled removals for issues relatively straightforward to address, often without needing deep engine shop visits.
(II) COMPLEX: Unscheduled removals for more complex or significant issues that typically necessitate a full engine shop visit.
- TOTAL SHOP VISITS:
The total number of times an engine underwent a significant maintenance event at an engine shop during the specified period, including major overhauls, repairs, or module changes.
- ENGINE CAUSED DELAYS/CANCELLATIONS:
The number of flight delays or cancellations directly attributed to engine issues during the period. This is a critical metric for operational disruption and associated costs.
- ENGINE DESPATCH RELIABILITY:
A percentage representing the proportion of planned flights that departed on time without any delay or cancellation caused by engine issues. It is a key indicator of the engine's readiness for service. High dispatch reliability is crucial for airline punctuality and customer satisfaction. (100 - ((Delays Due to Engine + Cancellations Due to Engine) x 100 x Number of Engines Fitted per Aircraft) / Engine Cycles)
Want to unlock predictive insights from your engine data?
Talk to Our Experts2.3 Safety & Trend Metrics:
- INFLIGHT SHUT DOWN (IFSD):
The number of instances where an engine was shut down during flight due to an uncommanded event or failure (not a planned shutdown). This is one of the most critical safety metrics.
(I) ENGINE CAUSED: IFSDs directly caused by an engine malfunction or failure.
(II) OTHER CAUSED: IFSDs caused by factors external to the engine itself (e.g., flight crew action, airframe issue).
- IFSD RATE / 1000 HRS:
The rate of in-flight shutdowns per 1,000 engine flight hours. It's a standardized metric for comparing engine safety performance. ((Total IFSDs / Total Engine Hours) * 1000)
- IFSD RATE 12 MONTH MOVING AVERAGE:
The average IFSD rate calculated over the preceding 12-month period. A moving average helps smooth out short-term fluctuations, providing a more stable trend indication of engine safety.
- TOTAL SHOP VISIT RATE/1000 HRS:
The rate of engine shop visits per 1,000 engine flight hours. This indicates how frequently engines require major maintenance. ((Total Shop Visits / Total Engine Hours) * 1000)
- MEAN TIME BETWEEN SHOP VISITS (MTBSV):
The average number of engine flight hours accumulated between successive shop visits. A higher MTBSV indicates better engine reliability and less frequent needs for major maintenance. (Total Engine Hours / Total Shop Visits)
- BASIC UNSCHED REMVL RATE / 1000 HRS:
The rate of "basic" unscheduled engine removals per 1,000 engine flight hours. ((Total Basic Unscheduled Removals / Total Engine Hours) * 1000)
- NON-BASIC UNSCHED REMVL RATE / 1000 HRS:
The rate of "non-basic" unscheduled engine removals per 1,000 engine flight hours. This is a more critical indicator as these removals are for significant issues. ((Total Non-Basic Unscheduled Removals / Total Engine Hours) * 1000)
- TOTAL ENGINE REMOVAL RATE / 1000 HRS:
The combined rate of all engine removals (scheduled + unscheduled) per 1,000 engine flight hours. This provides an overall view of how often engines are taken off-wing.
These fields collectively provide a comprehensive overview of engine health, operational reliability, and maintenance demands, empowering an AOC to make informed decisions about their fleet and maintenance strategies.
3. Visualizing Performance with Dashboards
Insights for Quick Decision Making (Anomalies Highlighted)
To make sense of this rich data, interactive dashboards are invaluable. They transform raw numbers into actionable insights, allowing for quick trend identification and anomaly detection.
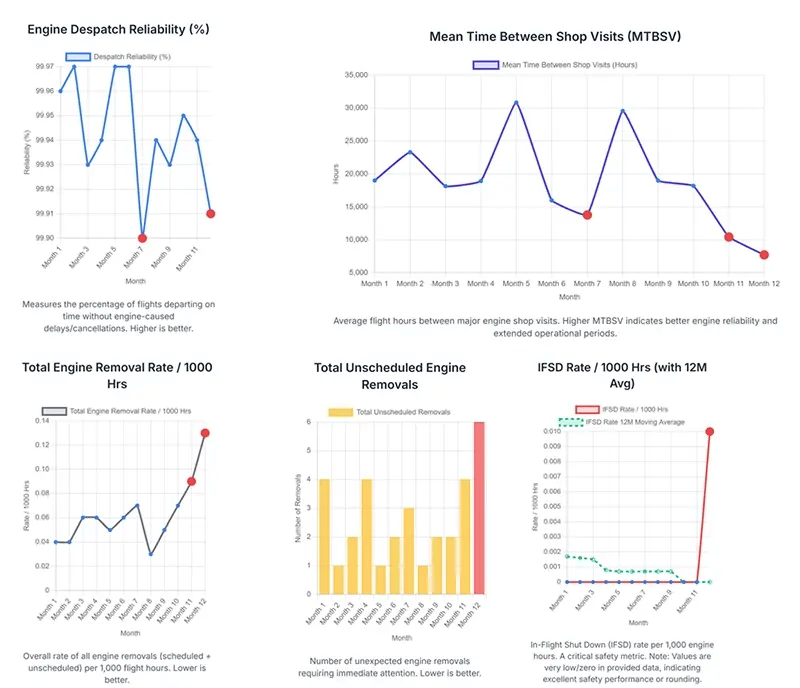
Summary Insights from the Dashboard:
- Despatch Reliability: A high percentage (consistently near 99.9% or above) indicates excellent operational readiness. Any significant dip warrants immediate investigation into the root cause.
- IFSD Rate: Ideally, this rate should be zero or extremely low. Even a small increase requires urgent attention as it impacts safety directly. The 12-month moving average provides a stable view of long-term safety performance.
- Unscheduled Removals: While some unscheduled events are unavoidable, a rising trend could indicate systemic issues, aging fleet challenges, or a need to refine predictive maintenance strategies.
- Total Removal Rate: This combines all engine removals. A stable or decreasing trend is positive. A rising trend suggests increased maintenance burden and potential costs.
- MTBSV: A consistently high MTBSV is a strong indicator of engine longevity and efficient maintenance programs. A decreasing trend suggests engines are requiring shop visits more frequently, potentially increasing MRO costs.
4. Detecting Anomalies in Engine Performance

- Engine Despatch Reliability (%):
Month 7 (99.90%) and Month 12 (99.91%): These months show the lowest despatch reliability percentages, indicating slight dips in operational readiness during these periods.
- IFSD Rate / 1000 Hrs (with 12M Avg): Month 12 (0.01%) for IFSD Rate / 1000 Hrs:
This is a critical anomaly. It is the only non-zero value for the monthly IFSD rate, signifying a highly significant safety event. Month 10, Month 11, Month 12 (0.0000) for IFSD Rate 12 Month Moving Average: The 12-month moving average drops to 0.0000 from Month 10 onwards, indicating that previous IFSD events (from earlier in the cumulative 12-month period) have rolled out of the calculation, resulting in a perfect 12-month moving average.
- Total Unscheduled Engine Removals: Month 12 (6 removals):
This is the highest number of unscheduled removals in a single month, representing a significant spike compared to other months and warranting immediate investigation.
- Total Engine Removal Rate / 1000 Hrs: Month 11 (0.09%) and Month 12 (0.13%):
These two months show a clear upward trend, with Month 12 being particularly elevated, indicating a recent increase in overall maintenance burden.
- Mean Time Between Shop Visits (MTBSV): Month 7 (13,786 hours):
Shows a notable dip in MTBSV compared to preceding and following months. Month 11 (10,444 hours) and Month 12 (7,733 hours): These represent a sharp and consistent decline in MTBSV, with Month 12 being the lowest point. This downward trend is a significant anomaly, indicating a worsening in engine longevity or an increased need for major maintenance.
Ready to move from reactive to predictive maintenance?
Schedule a Demo5. Unlocking Intelligence with AI-Powered Analytics
Beyond traditional charting and anomaly detection, Artificial Intelligence (AI) algorithms can unlock deeper insights and predictive capabilities from engine performance and reliability data, enabling more proactive and strategic decision-making. Here are some key AI algorithms and their applications:

- Time Series Forecasting:
(Autoregressive Integrated Moving Average ‘ARIMA’, Prophet, Long Short-Term Memory Networks ‘LSTMs’): These algorithms predict future trends in metrics like "Engine Hours," "Engine Cycles," "Despatch Reliability," and "Total Removal Rate." By analyzing historical patterns, they can forecast potential increases in workload or identify upcoming dips in reliability, allowing for proactive resource allocation or maintenance planning.
- Anomaly Detection (e.g., Isolation Forest):
Crucial for identifying unusual deviations in critical metrics like "IFSD Rate," "Total Unscheduled Removals," or "Engine Caused Delays/Cancellations." They can flag subtle events outside normal operating parameters, indicating potential emerging issues that might be missed by manual inspection.
- Regression Models (e.g., Linear Regression, Gradient Boosting):
Used for predictive maintenance, specifically to estimate Remaining Useful Life (RUL) or predict the "Mean Time Between Shop Visits (MTBSV)." By incorporating more detailed operational parameters (temperature, pressure, vibration data if available), these models provide precise predictions for individual engines or components.
- Classification Models(e.g., Decision Trees, Support Vector Machines):
For large granular data on the type of unscheduled removals or delays is available (e.g., specific component failure codes), classification models can predict the likelihood of certain failure types based on operational data, helping prioritize diagnostic efforts.
- Clustering Algorithms (e.g., K-Means):
Identify natural groupings or "clusters" of engines or operational periods that exhibit similar reliability characteristics. This helps segment the fleet for targeted maintenance strategies or identify common failure modes across specific operating conditions.
- Root Cause Analysis (e.g., Bayesian Networks):
With access to detailed fault codes, maintenance actions, and environmental conditions, AI can uncover non-obvious correlations and identify the true underlying causes of reliability issues, moving beyond superficial symptoms.
Implementing these AI algorithms would require access to more detailed and often real-time operational data from the aircraft and engines (e.g., sensor data, fault logs), along with robust data engineering and MLOps capabilities to manage the entire AI lifecycle.
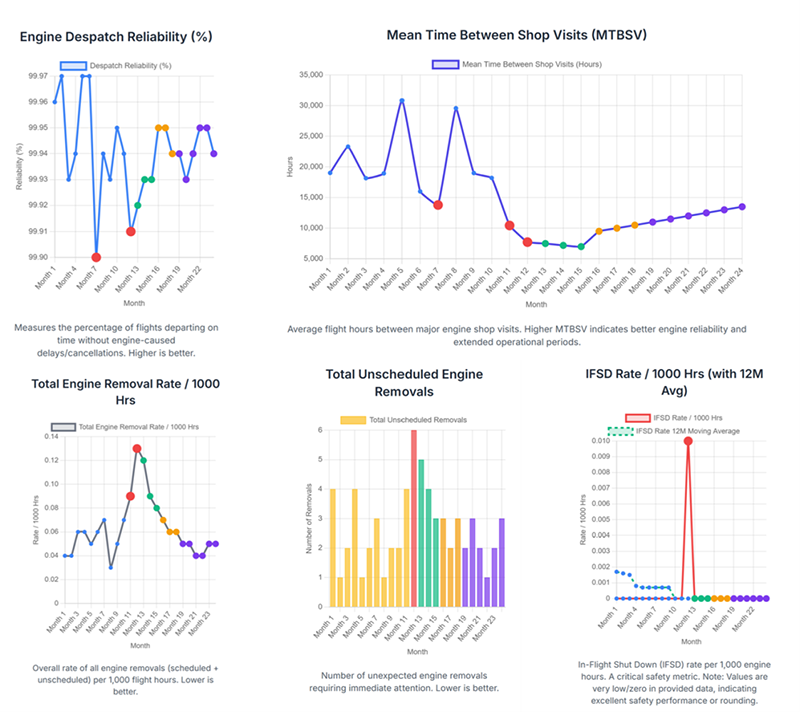
6. AI Simulated Multi-Month Trend for next 3 Months, 6 Months, and 12 Months
7. Conclusion: From Reactive to Predictive – The Path Forward
By combining a strong foundation in engine performance metrics with the advanced capabilities of artificial intelligence, AOC holders can shift from reactive maintenance to a fully predictive approach. This transformation not only improves operational efficiency and reduces maintenance costs, but also raises safety standards. With AI-driven insights, airlines can ensure their fleets remain reliable, resilient, and ready for the future.
8. About the Author
Sameer Panda

Senior Director - Aviation, Aerospace & Defense, Ramco Systems
Sameer Panda is a seasoned IT leader with over 20 years of experience in enterprise applications, with a deep focus on the aviation sector. As Business Head at Ramco Systems, he drives business development, service delivery, and customer success across MEA and APAC regions.
Certified in PgMP, PMP, ITIL, and SAFe Agilist, Sameer is known for his strategic leadership, client engagement, and ability to build strong cross-functional partnerships. A passionate advocate for AI-driven transformation, he helps aviation organizations move toward smarter, predictive operations that improve efficiency, reliability, and safety.
9. About Ramco Engine MRO Software
Ramco’s Engine MRO Software is a fully integrated solution designed to manage the end-to-end engine maintenance process. It connects planning, execution, engineering, supply chain, finance, and compliance in a single platform. From disassembly and inspection to parts tracking and assembly, the software offers complete operational visibility. With digital work instructions, automated work scoping, and real time analytics, it helps streamline workflows, reduce errors, and improve turnaround times.
Built on Ramco’s Aviation MRO suite, the Engine MRO module supports digital task cards, warranty tracking, and AI driven insights for smarter decision making. It simplifies collaboration with customers and suppliers while offering flexible billing options to maximize profitability.
Click here to know more about our product.